What is NPS®?
NPS®, or the Net Promoter Score/System®, has become one of the most widely used customer satisfaction metrics in modern business. It’s used by over two-thirds of Fortune 1,000 companies and while it isn’t perfect it has been the go-to for measuring customer satisfaction for almost 20 years. But what is NPS®, how is it calculated, and is it the right calculation for your business to monitor customer satisfaction?
NPS®, a brief history
The development of a simple, one line customer assessment question began in 1993 as the brainchild of Fred Reicheld, a partner at Bain & Company. The research tested a variety of questions to uncover the single most important one to determine customer lifetime value. The fundamental question of NPS® was born:
“How likely are you to recommend [company name] to a friend or colleague?”
In 2003 this idea was shared with the wider world. Published in the Harvard Business Review that year the article, entitled “The One Number You Need To Grow” began to weave its way into the fabric of customer culture within hundreds of corporations. Nowadays, Net Promoter Score® receives tens of thousands of search queries a month from individuals and businesses looking to implement the scoring system in their business. But how can you calculate your NPS®?
How to calculate your Net Promoter Score®
The question “How likely are you to recommend [company name] to a friend or colleague?” offers a single response type, a scale slider from 1 to 10. Each number offers a degree of likelihood with 1 being not at all likely, and 10 being very likely.
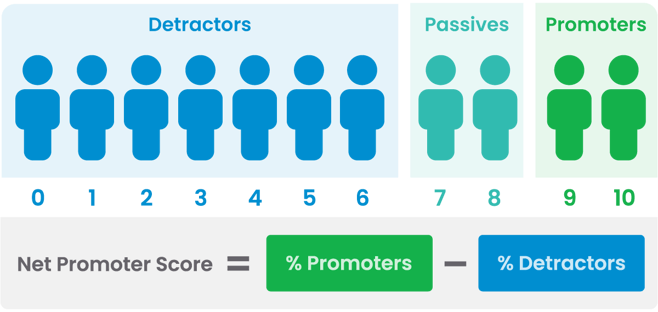
The NPS® system breaks down each of those numbers into satisfaction categories. Responses between 1 and 6 are known as ‘detractors’, people that didn’t have a good experience and won’t encourage others to buy from you. In fact, they may dissuade others from using your business. People that score your business a 7 or an 8 are ‘passives’, they aren’t likely to influence the actions of others. Those that score you 9 or 10 are ‘promoters’ and are likely to recommend your business to others.

To calculate your NPS® you work out what percentage of your overall responses are made up of detractors, minus that from the percentage of promoters to get your score. Therefore, this is the formula for calculating your NPS®:
% Detractors - % Promoters = NPS®
Here’s an example to show you how it’s done. Acme Inc has 100 responses overall. 60 are from ‘promoters’ (scores of 9 or 10), 20 are from ‘passives’ (scores of 7 or 8) and 20 are from ‘detractors’ (scores of 6 and below). We first work out the percentage made up of promoters and detractors.
Step 1: 100 (the total number of responses) ➗ 100 (the total percent) multiplied by 60 (the number of promoters). This gives us 60%.
Step 2: We then do the same for ‘detractors’. 100 (the total number of responses) ➗ 100 (the total percent) multiplied by 20 (the number of detractors). This gives us 20%.
Step 3: Finally, we minus ‘detractors’ from ‘promoters’ to get our score. 60 - 20 = 40. Acme Inc’s NPS® is 40.
What’s a good NPS® score?
Firstly, it’s technically correct to say ‘NPS® score’. NPS® was originally an acronym for ‘Net Promoter Score’, which means some may think it redundant to add the ‘score’, but Bain now prefers to call it the Net Promoter System, so adding ‘score’ after can be deemed correct.
A good NPS® score is difficult to benchmark as different industries have different rates of response and standard scores. For a business, a good NPS® is a higher one than last month or last year. The continuous improvement of your score is the aim of most businesses.
Industry benchmarks for NPS® vary widely and software platform Delighted helpfully shared many of these industry benchmarks for NPS®. Averages in some industries can be as low as 11, while others can be as high as 48 but before you get too excited about your score being higher than your industry average you might want to learn about some of the limitations of NPS®.
The limitations of NPS®
NPS® was created to offer a single line question to summarise the business value of that customer’s interaction with a business. Since its launch in 2003 NPS® has gone through several rounds of enhancements. As identified in a Harvard Business Review article in 2021, the calculation is vulnerable to misrepresentation and its credibility has been reduced over the years. This inspired the creators to work on a complementary scoring system that also leveraged accountancy figures to assess a customer’s business value. Termed NPS® 3.0, it uses earned growth as the metric for businesses to focus upon, rather than survey results.
In terms of the score’s accuracy when ranking current customer sentiment the system has additional limitations. For example, marketing professor Timothy Keiningham at St John’s University in New York pointed out that “the science behind NPS is bad” in a Wall Street Journal article. The flaws in a single-question survey metrics were further reinforced by a 2016 paper from the University of Cambridge, which saw issues with businesses relying too heavily on oversimplified measurements to base key business decisions.
What’s the alternative to NPS®?
There are few multi-dimensional scoring system alternatives to NPS®. CSAT is another limited metric system which is growing in popularity but any true customer satisfaction metric needs to utilise implicit and explicit data sets to truly show customer satisfaction.
That’s why Review Tui was created. Having read the Cambridge University paper on the importance of a multi-faceted approach to measuring customer satisfaction the team set out to build an algorithm that would do just that. 30 years ago, when NPS® was first being conceptualised, integrated systems and cloud-based business data storage were in their infancy. Few businesses had a CRM, let alone a tech stack of software solutions all capturing data and customer interactions.
Now that we have access to a fuller picture of client intent and action we can build a scoring system that isn’t reliant on a single question. We can build one that instantly, and autonomously, looks at dozens of data points a second. That’s where Review Tui comes in. Set to be launched later this year it offers businesses of all sizes a more integrated and accurate system for measuring customer satisfaction. If you’re interested in learning more then sign up for updates by clicking the button below.


